Builders and Processors
Overview
Report Sections are responsible for creating parts of the report document that represent a specific aspect of the data. To achieve this, they need to retrieve the data from the data source, process it using the appropriate business logic, and then visualize it meaningfully.
To improve and organize this process, we have introduced two core parts: Processors and Builders. Processors are responsible for fetching and processing KPI data, while Builders are responsible for creating visualizations (e.g., charts, tables) based on the processed KPI data.
Processors
Processors in the smartreport/v3/reports/common/processors module are designed to handle KPI data for various types of
entities, such as Drive, Motor, Asset, and Fleet. These processors provide a flexible interface (IDataProcessor) that
can be implemented to fetch and process KPI data for any entity type, ensuring consistency and reusability across
different report sections.
Interface
An interface IDataProcessor defines the method fetch, which retrieves data for an asset or fleet.
Implementations
Currently, there are the following implementations:
DriveAssetKpiDataProcessor: Processes the KPI data for individual drive assets.DriveFleetKpiDataProcessor: Processes the KPI data for drive fleets.

Builders
Builders in the smartreport/v3/reports/common/builders module are designed for various types of report components,
including Figures, tables, and styled text elements. This flexibility ensures that the processed data can be seamlessly
integrated into different visual or textual representations, enhancing the consistency and reusability across report
sections.
Interface
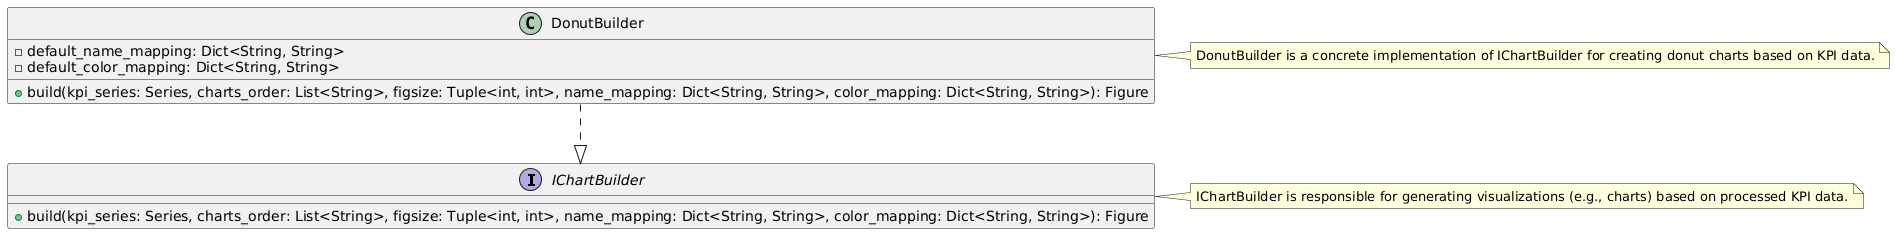
An interface IChartBuilder defines the method build, which generates visualizations based on report data.
Currently, there are the following implementations:
- DriveKPIDonutBuilder: Creates donut charts for KPI data.
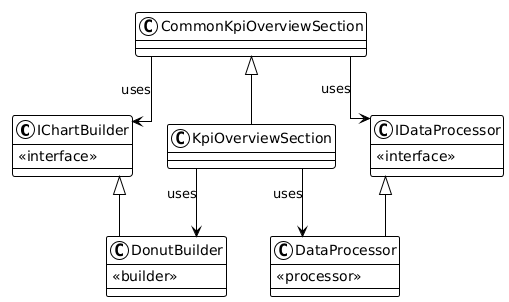
Integration with Report Sections
Each report section should use these processors and builders to fetch, process, and visualize report data effectively.
- chart_builder: An instance of
IChartBuilderused to create visualizations. - data_processor: An instance of
IDataProcessorused to fetch KPI data.
Proposed workflow for integrating Builders and Processors into Report Sections:
- Fetch Report Data:
- The
data_processorretrieves the report data for the specified entity (Asset or Fleet) and data identifier.
- The
- Build Charts:
- The
chart_buildergenerates visualizations (e.g., Plotly-figure, table) based on the fetched data.
- The
ReportSection uses IDataProcessor to fetch the data AND IChartBuilder to build the data visualization.