Signals
Raw data collected from SmartSensor is a set of vectors with measurement values, each with known sampling rate and scaling factor. Usually, those signals come in a CSV files with a header that contains metadata about the signal and the device that collected it.
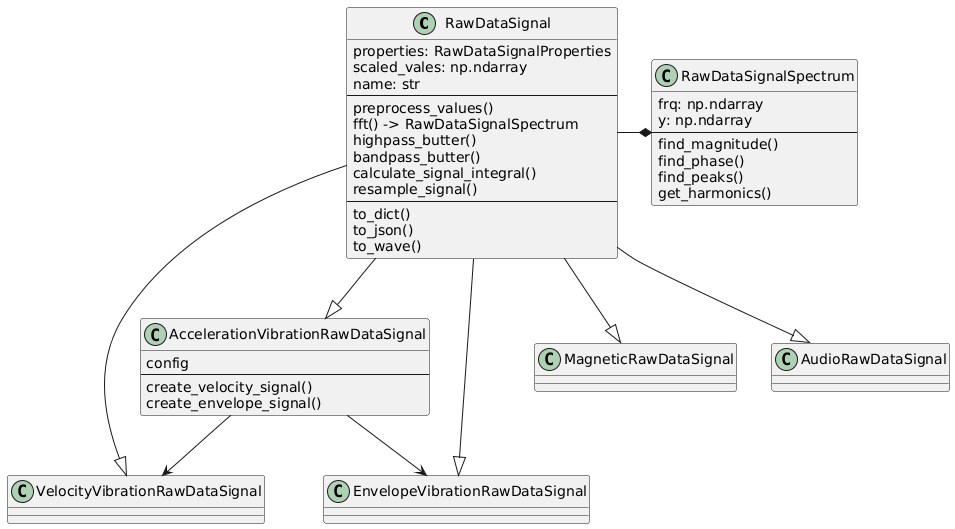
To represent the signal in a more convenient way, we use the RawDataSignal class that provides a data container
for the signal values and a set of methods to process the data. The RawDataSignal class is a base class for
various signal types, such as AccelerationVibrationRawDataSignal, MagneticVibrationRawDataSignal, etc.
The signal values are stored in a numpy array, and the class provides methods for filtering, scaling, and calculating the spectrum of the signal. The signal can be converted to different physical quantities (acceleration, velocity, displacement) and can be used for frequency analysis.
The CSV header is converted to RawDataSignalProperties model, which contains information like:
- source_file_name: The name of the source file containing the signal data.
- column: The column in the CSV file that contains the signal values.
- version: The version of the data format, e.g.,
1.0,1.1,1.2. - data_collection_unit: The unit used for data collection.
- sensor_type: The type of sensor that collected the data.
- timestamp: The timestamp of when the data was collected.
- sampling_frequency: The sampling frequency of the signal in Hz.
- unit: The unit of the signal values, e.g.,
g,mm/s. - scaling_factor: The scaling factor applied to the signal values.
- module_name: Optional name of the module that collected the data.
- rfid_tag: Optional RFID tag associated with the data.
- side: The side of the device where the signal was collected, default is UNKNOWN.
Class Hierarchy
The root class for all signals is RawDataSignal, which contains the core properties and methods for signal processing
in time domain.
Since the SmartSensor has multiple types of sensors, we have specialized classes for each type of signal:
- AccelerationVibrationRawDataSignal: Represents vibration acceleration data (g units)
- MagneticVibrationRawDataSignal: Represents magnetic vibration data (T units)
- AudioRawDataSignal: Represents audio data (Pa units)
The AccelerationVibrationRawDataSignal class is the most commonly used class, as it represents the vibration data collected by the SmartSensor. It contains methods for converting the signal to velocity and displacement, as well as methods for calculating the spectrum and finding peaks in the signal.
The .fft() method is used to calculate the Fast Fourier Transform (FFT) of the signal. It returns
the RawDataSignalSpectrum object that contains the frequency domain representation of the signal along with
methods for further analysis, such as finding or harmonics in the spectrum.
API
smartanalytics.raw_data.models.signals.signals.RawDataSignal
Bases: Sequence
Representation of Raw Data Signal structure. It represents a signal in the time domain with its properties and metadata.
Two main attributes are: - scaled_values: numpy array with scaled signal values - properties: RawDataSignalProperties object with signal metadata
The class provides methods to calculate signal statistics
It also provides methods to calculate the FFT spectrum of the signal.
This results in a RawDataSpectrum object that contains the signal representation in the frequency domain,
plus the methods to analyze the signal in the frequency domain, such as peak_detection harmonics, etc.
fs
property
Sampling frequency of the signal.
time
property
Returns time vector for the signal. It starts at 0 and has the same length as the signal.
__init__(values, properties, unit_standard=UnitStandard.METRIC, **kwargs)
Parameters:
| Name | Type | Description | Default |
|---|---|---|---|
values
|
ArrayLike
|
Signal values to be stored in the object. |
required |
properties
|
RawDataSignalProperties
|
RawDataSignalProperties object with signal metadata. |
required |
unit_standard
|
UnitStandard
|
Unit standard of the signal. Default is UnitStandard.METRIC. |
METRIC
|
Other Parameters:
| Name | Type | Description |
|---|---|---|
name |
str
|
Optional name of the signal. Default is "Raw Data Signal". |
spectrum |
Tuple[ndarray, ndarray]
|
Optional precalculated FFT spectrum of the signal. If provided, then the spectrum is used as a result of the FFT calculation. |
nan_limit |
float
|
Maximum allowed percentage of NaNs in the signal. Default is 1.0. |
remove_trend |
bool
|
Whether to remove the linear trend from the values. Default is False. |
remove_mean |
bool
|
Whether to remove the mean from the values. Default is False. |
bandpass_butter(values=None, cut_off_low=10.0, cut_off_high=1000.0, filter_order=3)
Filter signal values using the bandpass Butterworth filter.
It uses the smartanalytics.signal.filter.bandpass_butter function to filter the signal values.
If the values are not provided, then the self.scaled_values are used.
Parameters:
| Name | Type | Description | Default |
|---|---|---|---|
values
|
Optional[ndarray]
|
Optional values array to filter. If not provided, then self.scaled_values is used. |
None
|
cut_off_low
|
float
|
The low frequency limit where the gain drops -3dB. Default is 10 Hz. |
10.0
|
cut_off_high
|
float
|
The high frequency limit where the gain drops -3dB. Default is 1000 Hz. |
1000.0
|
filter_order
|
int
|
The order of the filter. Default is 3. |
3
|
Returns:
| Type | Description |
|---|---|
ndarray
|
The filtered signal values |
calculate_signal_integral(values, fs)
Calculates the integral of the signal values.
It uses the smartanalytics.signal.time.integrate_data function to calculate the integral of the signal values.
If the values are not provided, then the self.scaled_values are used.
If the fs is not provided, then the self.fs is used.
Parameters:
| Name | Type | Description | Default |
|---|---|---|---|
values
|
Optional[ndarray]
|
Optional values array to calculate the integral from. If not provided, then self.scaled_values is used. |
required |
fs
|
Optional[float]
|
Optional sampling frequency of the signal. If not provided, then self.fs is used. |
required |
Returns:
| Type | Description |
|---|---|
ndarray
|
The integral of the signal values. |
crest_factor()
Calculates crest factor value (peak amplitude to rms ratio) ignoring any NaNs
fft(values=None, fs=None, use_hann_window=True, window_factor=2.0, use_c_fft=True, cut_off_low=None, cut_off_high=None, filter_order=3, force=False)
Calculates FFT spectrum of the signal values.
If the precalculated spectrum exists in the object, and the force flag is False, then the precalculated
spectrum is returned without redundant calculations.
If the signal length is correct and the use_c_fft is selected then we use the CommonAlgo FFT implementation.
Otherwise, it uses the smartanalytics.signal.frequency.fft_spectrum function to calculate the FFT spectrum.
If the values are not provided, then the self.scaled_values are used.
If the cut_off_low and cut_off_high are provided, then the signal is filtered before FFT calculation.
Parameters:
| Name | Type | Description | Default |
|---|---|---|---|
values
|
Optional[ndarray]
|
Optional values array to calculate FFT from. If not provided, then self.scaled_values is used. |
None
|
fs
|
Optional[float]
|
Optional sampling frequency of the signal. If not provided, then self.fs is used. |
None
|
use_hann_window
|
bool
|
If True, then Hanning window is applied to the signal before FFT calculation. |
True
|
window_factor
|
float
|
Factor used to calculate the length of the Hanning window. |
2.0
|
use_c_fft
|
bool
|
If True, then the C implementation of FFT, from CommonAlgo, of FFT is used. |
True
|
cut_off_low
|
Optional[float]
|
Low cutoff frequency for bandpass filter. If provided, then the signal is filtered before FFT. |
None
|
cut_off_high
|
Optional[float]
|
High cutoff frequency for bandpass filter. If provided, then the signal is filtered before FFT. |
None
|
filter_order
|
int
|
Order of the Butterworth filter used for bandpass filtering. Default is 3. |
3
|
force
|
bool
|
If True, then the precalculated spectrum is ignored and the new spectrum is calculated. |
False
|
Returns:
| Type | Description |
|---|---|
Optional[RawDataSignalSpectrum]
|
Tuple of two arrays: frequencies and magnitudes of the FFT spectrum. |
highpass_butter(values=None, cut_off_low=10.0, filter_order=3)
Filter signal values using the highpass Butterworth filter.
It uses the smartanalytics.signal.filter.highpass_butter function to filter the signal values.
If the values are not provided, then the self.scaled_values are used.
Parameters:
| Name | Type | Description | Default |
|---|---|---|---|
values
|
Optional[ndarray]
|
Optional values array to filter. If not provided, then |
None
|
cut_off_low
|
float
|
The low frequency limit where the gain drops -3dB. Default is 10 Hz. |
10.0
|
filter_order
|
int
|
The order of the filter. Default is 3. |
3
|
Returns:
| Type | Description |
|---|---|
ndarray
|
The filtered signal values. |
kurtosis()
Calculates kurtosis (fourth standardized moment) of a signal ignoring any NaNs
max(*args, **kwargs)
Calculates maximum value in the signal (scaled values array) ignoring any NaNs
mean(*args, **kwargs)
Calculates arithmetic mean of the signal (scaled values array) ignoring any NaNs
min(*args, **kwargs)
Calculates minimum value in the signal (scaled values array) ignoring any NaNs
ptp(*args, **kwargs)
Calculates difference between maximum and minimum values in the signal (scaled values array) ignoring any NaNs
resample_signal(new_fs, add_filter=False, **kwargs)
Resamples the signal to a new sampling frequency.
It uses the scipy.interpolate.interp1d function to interpolate the signal values.
If add_filter flag is set, it applies a bandpass filter to the resampled signal.
Parameters:
| Name | Type | Description | Default |
|---|---|---|---|
new_fs
|
int
|
The new sampling frequency to resample the signal to. |
required |
add_filter
|
bool
|
Whether to apply a bandpass filter to the resampled signal. Default is False. |
False
|
Other Parameters:
| Name | Type | Description |
|---|---|---|
low_cutoff |
float
|
The low cutoff frequency for the bandpass filter. Default is 1 Hz. |
high_cutoff |
float
|
The high cutoff frequency for the bandpass filter. Default is half of the original sampling frequency. |
filter_order |
int
|
The order of the Butterworth filter. Default is 3. |
Returns:
| Type | Description |
|---|---|
ndarray
|
The resampled signal values. |
rms()
Calculates the root-mean-square of a signal ignoring any NaNs
std(*args, **kwargs)
Calculates standard deviation, a measure of the spread of a distribution of the signal (scaled values array) ignoring any NaNs
to_dict(include_time=False, mode='python')
Returns the signal content as a dictionary.
Parameters:
| Name | Type | Description | Default |
|---|---|---|---|
include_time
|
bool
|
If True, then the time vector is included in the output dictionary. Default is False. |
False
|
mode
|
Literal['python', 'json']
|
The mode of the output dictionary. Default is "python". Possible values are "python" and "json". |
'python'
|
Returns:
| Type | Description |
|---|---|
Dict
|
The signal content as a dictionary. |
to_json(include_time=False, **kwargs)
Returns the signal content as a JSON string.
Parameters:
| Name | Type | Description | Default |
|---|---|---|---|
include_time
|
bool
|
If True, then the time vector is included in the output JSON string. Default is False. |
False
|
Other Parameters:
| Name | Type | Description |
|---|---|---|
kwargs |
dict
|
Additional keyword arguments to pass to the JSON encoder. |
Returns:
| Type | Description |
|---|---|
str
|
The signal content as a JSON string. |
to_wave(path, normalization_level=None, sampling_rate=None, use_window=True, wave_length=None, **kwargs)
Saves signal content as a WAV format file.
If path is a string, then it is treated as a path to a file.
Parameters:
| Name | Type | Description | Default |
|---|---|---|---|
path
|
Union[Path, str, BytesIO]
|
Path to a file or an open file handler. |
required |
normalization_level
|
Optional[float]
|
Normalization level in units of scaled data. If not provided, then maximum value in the signal is used. |
None
|
sampling_rate
|
Optional[int]
|
Sampling rate of an output file. If not provided, then sampling rate of a signal is used. |
None
|
use_window
|
bool
|
If true, then the Hanning window is used to smooth the edges of the signal. This prevents "clicks" when looping the audio file. |
True
|
wave_length
|
Optional[float]
|
Desired length of output Wave file (in seconds). If not provided, then length of original signal is used. |
None
|
Other Parameters:
| Name | Type | Description |
|---|---|---|
window_proportion |
int
|
Proportion of signal length used to create Hanning window. |
smartanalytics.raw_data.models.signals.signals.AccelerationVibrationRawDataSignal
Bases: RawDataSignal
Specific class for Vibration Acceleration Signal. It is equipped with additional calculation functions. It can be used to create Velocity and Envelope signals.
calculate_rms_of_velocity_signal(unit_standard=UnitStandard.METRIC, cut_off_low=10.0, cut_off_high=1000.0)
Calculates the RMS of the Vibration Velocity Signal.
It uses the smartanalytics.signal.time.c_rms_of_integrated_signal function to calculate the RMS of the signal.
It doesn't calculate the integral of the signal, but it uses the FFT spectrum of the signal to calculate the RMS. Therefore, the FFT has to be adjusted with the Hann window correction factor.
Parameters:
| Name | Type | Description | Default |
|---|---|---|---|
unit_standard
|
UnitStandard
|
The unit standard of the signal. Default is "metric". |
METRIC
|
cut_off_low
|
float
|
The low cutoff frequency for bandpass filter. Default is 10 Hz. |
10.0
|
cut_off_high
|
float
|
The high cutoff frequency for bandpass filter. Default is 1000 Hz. |
1000.0
|
Notes
Vibration Velocity unit depends on the unit_standard parameter,
and assumes the Vibration Acceleration unit is [g].
In imperial system, the Vibration Velocity unit is [in/s].
Returns:
| Type | Description |
|---|---|
float
|
The RMS of the Vibration Velocity Signal. |
create_envelope_signal(cut_off_low=10.0, filter_order=3)
Creates the EnvelopeVibrationRawDataSignal class that represents the envelope of Vibration Acceleration Signal.
It uses the _calculate_envelope_values method to calculate the envelope of the signal,
and updates the raw signal properties to represent the envelope of the acceleration signal.
Parameters:
| Name | Type | Description | Default |
|---|---|---|---|
cut_off_low
|
float
|
The low cutoff frequency for bandpass filter. Default is 10 Hz. |
10.0
|
filter_order
|
int
|
The order of the filter. Default is 3. |
3
|
Returns:
| Type | Description |
|---|---|
EnvelopeVibrationRawDataSignal
|
The EnvelopeVibrationRawDataSignal class that represents the envelope of the Vibration Acceleration Signal. |
create_velocity_signal(unit_standard=UnitStandard.METRIC, cut_off_low=10.0, cut_off_high=1000.0, filter_order=3)
Creates the VelocityVibrationRawDataSignal class that represents the Vibration Velocity Signal.
It uses the _calculate_velocity_values method to calculate the velocity values,
and updates the raw signal properties to represent the velocity signal.
Parameters:
| Name | Type | Description | Default |
|---|---|---|---|
unit_standard
|
UnitStandard
|
The unit standard of the signal. Default is "metric". |
METRIC
|
cut_off_low
|
float
|
The low cutoff frequency for bandpass filter. Default is 10 Hz. |
10.0
|
cut_off_high
|
float
|
The high cutoff frequency for bandpass filter. Default is 1000 Hz. |
1000.0
|
filter_order
|
int
|
The order of the filter. Default is 3. |
3
|
Notes
Vibration Velocity unit depends on the unit_standard parameter,
and assumes the Vibration Acceleration unit is [g].
In imperial system, the Vibration Velocity unit is [in/s].
Returns:
| Type | Description |
|---|---|
VelocityVibrationRawDataSignal
|
The VelocityVibrationRawDataSignal class that represents the Vibration Velocity Signal. |
smartanalytics.raw_data.models.signals.signals.MagneticRawDataSignal
smartanalytics.raw_data.models.signals.signals.AudioRawDataSignal
smartanalytics.raw_data.models.signals.signals.RawDataSignalSpectrum
Represents a Raw Data Signal in a frequency domain. This class is used to analyze the frequency domain of a raw data signal.
It provides methods to find the magnitude and phase at specific frequencies, find peaks in the spectrum, and get harmonics of the signal.
Two main attributes are frq (frequencies) and y (spectrum values).
The frq is an array of frequencies in Hz, and y is the complex spectrum values at those frequencies.
Additionally, mag is calculated as the absolute value of y, representing the magnitude of the spectrum.
find_magnitude(frequency, fs=None, use_dpeaks=False, **kwargs)
Returns magnitude of the signal at a specific frequency. First, it calculates the FFT spectrum of the signal and then finds the magnitude at the given frequency.
If the use_dpeaks flag is set, then the magnitude is calculated using the internal D-Peaks implementation.
Otherwise, it uses the smartanalytics.signal.frequency.find_magnitude function to find the magnitude.
Parameters:
| Name | Type | Description | Default |
|---|---|---|---|
frequency
|
float
|
The frequency at which to find the magnitude. |
required |
fs
|
Optional[float]
|
Optional sampling frequency of the signal. If not provided, then self.fs is used. |
None
|
use_dpeaks
|
bool
|
If True, then the magnitude is calculated using the internal D-Peaks implementation.
Otherwise, it uses the |
False
|
Other Parameters:
| Name | Type | Description |
|---|---|---|
kwargs |
dict
|
Additional keyword arguments to pass to the FFT calculation. |
Returns:
| Type | Description |
|---|---|
float
|
The magnitude of the signal at the given frequency. |
find_peaks(use_dpeaks=False, peaks_cut_off_high=1000.0, **kwargs)
Finds the peaks from the signal spectrum. First, it calculates the FFT spectrum of the signal and then finds the peaks in the spectrum. Then it searches for the peaks in the spectrum.
If the use_dpeaks flag is set, then the peaks are calculated using the internal D-Peaks implementation.
Otherwise, it uses the smartanalytics.signal.peak_detection.get_peaks function to find the peaks.
If the peaks_cut_off_high is provided, then the peaks above this frequency are removed.
Parameters:
| Name | Type | Description | Default |
|---|---|---|---|
use_dpeaks
|
bool
|
If True, then the peaks are calculated using the internal D-Peaks implementation. Otherwise, it uses the scipy.time.find_peaks. Default is True. |
False
|
peaks_cut_off_high
|
Optional[float]
|
High cutoff frequency for peaks [Hz]. Default is 1000.0. |
1000.0
|
Returns:
| Type | Description |
|---|---|
List[SpectrumPoint]
|
Tuple of two arrays: frequencies and magnitudes of the peaks. |
find_phase(frequency, fs=None, use_dpeaks=False, **kwargs)
Returns phase of the signal at a specific frequency. First, it calculates the FFT spectrum of the signal and then finds the phase at the given frequency.
If the use_dpeaks flag is set, then the phase is calculated using the internal D-Peaks implementation.
Otherwise, it uses the smartanalytics.signal.frequency.find_phase function to find the phase.
Parameters:
| Name | Type | Description | Default |
|---|---|---|---|
frequency
|
float
|
The frequency at which to find the phase. |
required |
fs
|
Optional[float]
|
Optional sampling frequency of the signal. If not provided, then self.fs is used. |
None
|
use_dpeaks
|
bool
|
If True, then the magnitude is calculated using the internal D-Peaks implementation.
Otherwise, it uses the |
False
|
Other Parameters:
| Name | Type | Description |
|---|---|---|
kwargs |
dict
|
Additional keyword arguments to pass to the FFT calculation. |
Returns:
| Type | Description |
|---|---|
float
|
The phase of the signal at the given frequency. |
find_top_peaks(no_peaks=5, use_dpeaks=False, peaks_cut_off_high=1000.0, **kwargs)
Returns top peaks from the spectrum
Parameters:
| Name | Type | Description | Default |
|---|---|---|---|
no_peaks
|
int
|
Number of peaks to be returned |
5
|
use_dpeaks
|
bool
|
If True, then the peaks are calculated using the internal D-Peaks implementation. Otherwise, it uses the scipy.time.find_peaks. Default is True. |
False
|
peaks_cut_off_high
|
Optional[float]
|
High cutoff frequency for peaks [Hz]. Default is 1000.0. |
1000.0
|
Other Parameters:
| Name | Type | Description |
|---|---|---|
kwargs |
dict
|
Additional keyword arguments to pass to the FFT calculation. |
Returns:
| Type | Description |
|---|---|
List[SpectrumPoint]
|
list of tuples with frequency and magnitude of peaks |
get_harmonics(harmonic_frequency, no_of_harmonics=10, **kwargs)
Returns the list with signal's harmonics. The output is a list of SpectrumPoint (frequency, magnitude, phase) objects.
We search for the harmonics values close to the peaks found in the signal spectrum. Later we calculate the magnitude and phase of the harmonics that are not found in the peaks.
Parameters:
| Name | Type | Description | Default |
|---|---|---|---|
harmonic_frequency
|
float
|
Harmonic frequency of the signal. [Hz] It can be the speed of the machine for vibration signals. |
required |
no_of_harmonics
|
int
|
Number of harmonics to be returned |
10
|
Returns:
| Type | Description |
|---|---|
List[SpectrumPoint]
|
List of harmonics values, as SpectrumPoint objects, sorted by frequency. |