Report engine
Every report can be divided into two essential parts: data and structure. This part of documentation deals with the report structure, while the details of the data types used in the project are described here.
On the very high level, every report document can be considered as a sequence of components like text, image, plot or table. Those components might be grouped into sections that starts with headings and are separated with line or page breaks.
Report engine provides tools to add those elements into an abstract report document in any desired order, and then to export that document object into a supported file format.
Report Output interface
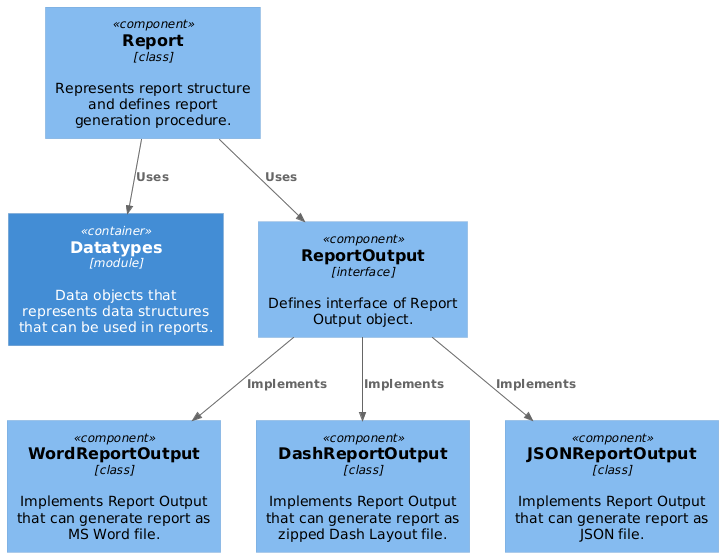
ReportOutput is an interface that defines methods for adding content to document. It is documented here
Currently, there are three supported report document formats:
- Word - Microsoft Word document. Can be opened with MS Office and provides a static document, to be printed out.
- Dash - custom format based on JSON. Can be loaded by Dash server that will render it into interactive HTML web page.
- JSON - JSON file. Can be used for tests.
Example
Below you can find an example that creates a demo report end exports it to a Word file.
# Imports
from smartreport.datatypes.mocks.trend import generate_random_trend
from smartreport.datatypes.mocks.signal import generate_random_vibration_signal
from smartreport.engine.outputs.word_document import WordReportOutput
from smartreport.report.templates import DefaultTemplates
from smartreport.plot.plotly.trend import plot_trend
from smartreport.plot.plotly.signals import plot_signal_in_time, plot_signal_in_frequency

# Data preparation
trend = generate_random_trend(kpi_id="31", asset_name="Asset 01")
signal = generate_random_vibration_signal()

ro = WordReportOutput(DefaultTemplates.measurement.word)

# Adding report content
ro.add_hyperlink(text="Visit me!", url="www.abb.com")
ro.add_heading("Trend Plots", level=1)
ro.add_heading("Single Trend with Inverted Threshold", level=2)
ro.add_figure(figure=plot_trend(trend=trend))
ro.add_page_break()
ro.add_heading("Signals", level=1)
ro.add_figure(figure=plot_signal_in_time(signal=signal))
ro.add_figure(
    figure=plot_signal_in_frequency(
        signal=signal,
        vertical_lines=[
            {"group_name": "Sidebands", "values": [12, 14], "labels": ["A1", "A2"]},
            {"group_name": "Peaks", "values": [5, 7, 9], "labels": ["Peak 1", "Peak 2", "Peak 3"]},
        ],
    )
)
ro.add_page_break()
ro.add_heading(text="Drive Details", level=2)
ro.add_table(
    table_data=[
        ["Name", "Value"],
        ["Product name", "ACS800-104LC-0705-7+E205"],
        ["Serial no", "8104601597"],
        ["Loading package", "AC7300"],
        ["Cooling type", "air"],
        ["Commissioning", "2010-11-15"],
        ["Warranty end", "2012-11-19"],
    ]
)

# Exporting report to a file
ro.export(filepath="DemoReport001")
Report class
Each report is implemented based on Report class. Steps to create a report content have to be defined in .generate_report() method.
Report class has to be initialized with an instance of ReportOutput that will be available as _ro attribute.
Setting up report title and subtitle
.generate_report() function mentioned above can take 2 optional arguments corresponding with title and subtitle of the report. To set up title and subtitle this function needs to call create_title_section() and take arguments as below:
test_report.generate_report(title='Test title', subtitle='Test subtitle')
Example
Below you can find an example that defines a demo report class.
from smartreport.datatypes.asset import MotorAsset
from smartreport.engine.outputs import ReportOutput
from smartreport.report.report import Report
from smartreport.plot.plotly.trend import plot_trend
from smartreport.plot.plotly.signals import plot_signal_in_time


class TestReport(Report):
    def __init__(self, report_output: ReportOutput, asset: MotorAsset):
        super(TestReport, self).__init__(report_output)
        self.asset = asset

    def generate_report(self, *args, **kwargs):
        self._ro.add_hyperlink(text="Visit me!", url="www.abb.com")
        self._ro.add_heading("Trend Plots", level=1)
        self._ro.add_figure(figure=plot_trend(trend=self.asset.trend(kpi_id="1")))
        self._ro.add_page_break()

        self._ro.add_heading("Signals", level=1)
        measurement = self.asset.get_measurements()[0]
        signal = measurement.signals["acc1000.x_val"]
        self._ro.add_figure(figure=plot_signal_in_time(signal=signal))
        self._ro.add_page_break()
        self._ro.add_heading(text="Drive Details", level=2)
        self._ro.add_table(
            table_data=[
                ["Name", "Value"],
                ["Asset ID", self.asset.id],
                ["Asset Name", self.asset.name],
                ["Asset Type", self.asset.type],
            ]
        )