Data types
Every report can be divided into two essential parts: data and structure. This part of documentation deals with the data part, while the details of the report structure are described here.
Content comes from several sources, like SmartSensor API, Raw Data Collector, MCCU API or Drive DB. Each source has its own custom connector and provides a data unique format and structure. On the other hand, for simplicity of report development, only few data structures are needed. Time series, vectors with raw signals, and structures that can handle collection of both is enough to handle most of the report numerical content, while simple dict-like structures are mostly fine for handling with data like device properties or metadata.
On the high level datatypes can be divided into two main groups.
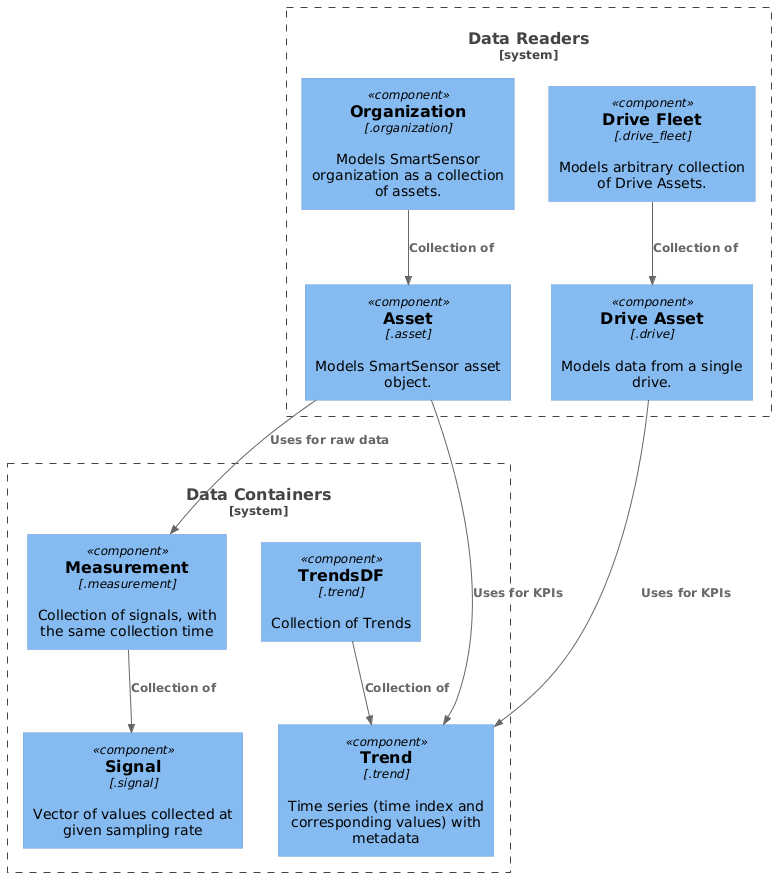
Data containers
These objects store the data in a form convenient for the analysis and visualisation in the report. They have some extra methods that help with data processing, but does not have any methods that read the data from external sources.
Because of above, external data is provided to them only at initialization.
Datatypes that belong to this group:
- Trend - Time series (time index and corresponding values) with metadata
- TrendsDF - Collection of Trends, with shared time index
- Signal - Vector of values collected at given sampling rate
- Measurement - Collection of signals, with the same collection time
Trend
Trend is a data structure used to store KPI time series with extra properties, like unit, kpi_id or threshold. It inherits from Pandas Series object and therefore shares all methods and api with it. This makes it very powerful with data manipulation yet easy to use for everyone familiar with Pandas package.
import pandas as pd
from smartreport.datatypes.trend import Trend
from smartreport.datatypes.mocks.trend import generate_random_trend

# Helper function that generates trend object with random data
t = generate_random_trend()
assert isinstance(t, Trend) and isinstance(t, pd.Series)

# Slicing
t1 = t[1:10]
# Aggregating
t_mean = t.mean()
# Resampling
t_1m = t.resample("15min").last()

# Accessing the inner pandas series
t_series = t.naive
assert isinstance(t_series, pd.Series) and not isinstance(t_series, Trend)

# Accessing its custom properties
print(t.unit, t.kpi_id, t.threshold)
In addition to standard methods inherited from Series, Trend has also few extra methods implemented.
distribution_by_threshold(threshold: Threshold = None, **kwargs) -> Chart- returns a Chart object that hold information about amount of time spent in one of four states: no data, ok (<warning), tolerable (warning<xextend(start_date: datetime.datetime, end_date: datetime.datetime, **kwargs) -> Trend- returns an extended and Trend that spans between start_date and end_dateupsample(self, **kwargs) -> Trend- returns an up-sampled trend.normalize(**kwargs)- returns normalized version of a Trend. Values are in range <0.0,1.0> and normalization is based on threshold values and limit values from look-up table.
SmartSensor Asset object use Trend to store the KPI measurements from /Measurement/Values endpoint.
To simplify conversion between API response and Trend object there is a static method
called from_ss_api_response that will create a valid Trend object based on the data received from SmartSensor API.
TrendsDF
This structure is used to combine Trends object into a collection that is aligned by its index. Internally Pandas DataFrame is used, but TrendsDF doesn't inherit from it, but only uses it as a storage for Trends' data.
It implements __getitem__ and __setitem__ (square brackets) interface to store and retrieve Trends.
Also, it preserves Trends as a type of output data.
import datetime
from smartreport.datatypes.trend import TrendsDF, Trend
from smartreport.datatypes.mocks.trend import generate_random_trend

# Helper function that generates trend object with random data
# t2 has index shifted by 10 min compared to t1
length = 10
t1 = generate_random_trend(length=length, start_timestamp=datetime.datetime(2020, 1, 1, 1, 0, 0))
t2 = generate_random_trend(length=length, start_timestamp=datetime.datetime(2020, 1, 1, 1, 10, 0))

t_sum = t1 + t2
# Since indices of t1 and t2 are misaligned the result of the summation will be twice as long
assert len(t_sum) == 2 * length

tdf = TrendsDF()
tdf["T1"] = t1
tdf["T2"] = t2
tdf_sum = tdf["T1"] + tdf["T2"]
assert isinstance(tdf["T1"], Trend)
# By using TrendsDF() as an intermediate container, trends "T1" and "T2" are now aligned
# so the summation results in length = 10
assert len(tdf_sum) == length
Signal
Raw data collected from SmartSensor is a set of vectors with measurement values, each with known sampling rate and scaling factor. Those vectors are represented by Signal class, that provides not only a data container, but also a bunch of helpful methods to transform and process the data.
from smartreport.datatypes.signal import Signal
from smartreport.datatypes.mocks.signal import generate_vibration_signal

# Helper function that generates signal object with random data (vibration data)
s = generate_vibration_signal()
assert isinstance(s, Signal)

# There are statistical methods build into the Signal
print(s.kurtosis(), s.crest_factor(), s.rms())

# FFT analysis is also simple
frq, y = s.fft()

# as well as signal filtering
yf = s.bandpass_butter()
Measurement
Since raw data is usually received as a collection of data vectors (signals from vibration sensor, magnetic sensor
and microphone) along with metadata describing this collection (timestamp, sensor parameters,
snapshot of other values at the sensor) it is useful to represent that structure in the code. It is called measurement,
and it contains collection of .signals (as a dict), .parameters describing the state
at which those signals were captured, along with several methods and properties that can be used in the
report generation process and require the knowledge about not only individual signals but the whole 'measurement'.
While Measurement class defines an interface, currently there is only one available implementation of it, called JobMeasurement. It is representing data collected from SmartSensor sensor. It also extends the functionality with some extra methods.
One of the above examples is a speed estimation algorithm that requires vibration and magnetic field signals along
with information about nominal values of the machine at which those signals were captured. All of that is available
at Measurement level, so the .get_speed method can be introduced.
Other methods used by the reports are:
filter_signal()- finds the signals hold by the measurement that met provided filter criteria (e.g. sampling frequency, module name, signal type)to_json()- exports JobMeasurement to JSON fileto_csv()- exports JobMeasurement to set of CSV files (one per signal type)
Measurement can be initialized from external files or data streams in two main formats (JSON and CSV). There are static methods available that allows to initialize the Measurement object directly from those:
read_json()- initializes JobMeasurement from JSON file.read_csv()- initializes JobMeasurement from single CSV file.read_many_csv()- initializes JobMeasurement from several CSV files.read_file()- automatically uses one of the above based on the provided file.
SmartSensor data readers
These objects are bigger structures that combines several data containers and other basic data structures. Those collections represent external (business) objects that are subject of the reporting activities. What is very important, they require a data reading component to be provided at initialization, that allow them to lazily fetch the data from external sources.
Datatypes that belong to this group:
- Asset - Models SmartSensor asset object. Can read asset data, properties, kpis (as Trends), and raw data (as Measurements).
- Organization - Models SmartSensor organization as a collection of assets with extra metadata.
- DriveAsset - Models data from a single drive. Can read drive properties and kpis (as Trends)
- DriveFleet - Models arbitrary collection of Drive Assets.
Asset
The data sources for data types defined in this section are Smart Sensor devices.
Asset is the core data structure that represents a single object being monitored by a condition monitoring device, and that is a subject of reporting activities.
One of the main features of data coming from sensors is that they are going in two different styles:
1) Devices are performing periodic measurements (usually every 1h) and they are reporting only the main properties (like mean value, standard deviation, kurtosis, etc.) of measured signals. 2) Device might be triggered to perform so call raw data collection - in such a case device performs measurement and send all measured data.
On the data perspective, it contains information describing the monitored machine and actual values of raw data measurement and KPIs (represented by the structures defined in previous chapters and limited by start_date and end_date parameters provided at initialization).
Secondly, each asset object have to be initialized with AssetDataReader object that provides methods to get the data from external sources and asset_id that identifies which SmartSensor Asset object it represents.
Asset provides many methods and properties that are used throughout the report generation process. Essential ones are following:
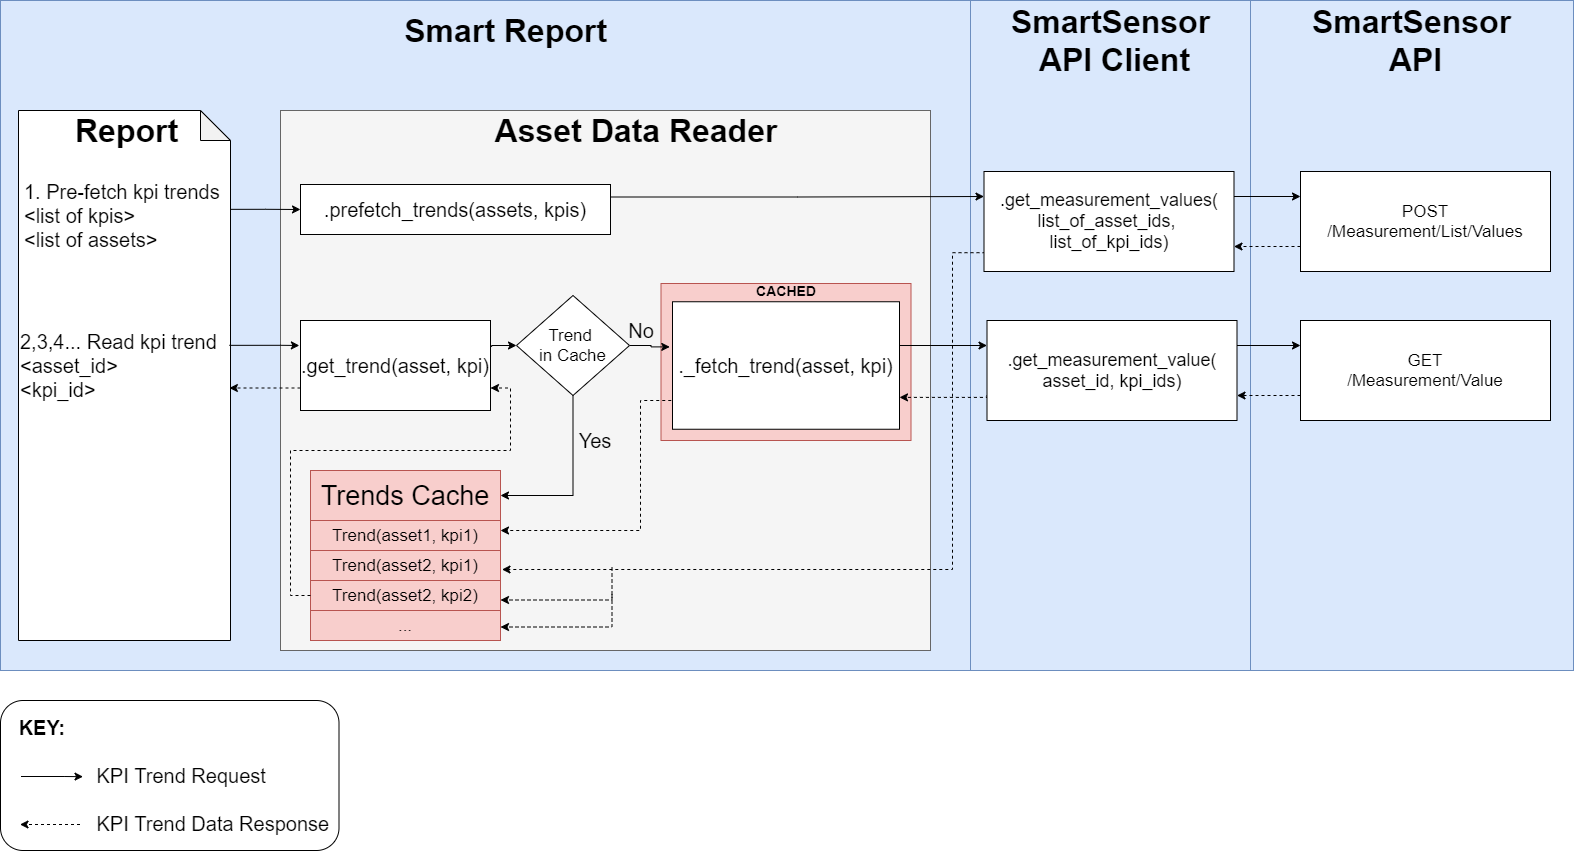
name- Asset nametype- Asset typeorganization_id- ID of asset's organizationsensor_type_id- ID of asset's sensorsensor_mac- MAC of asset's sensorasset_details- Dictionary with all Asset detailsbearing_frequencies- Dictionary with asset's bearing frequenciesget_property_value(key)- returns assets property stored under keyget_measurements()- returns JobMeasurements' list for the Assetthreshold(kpi_id)- returns Threshold for given kpi_idtrend(kpi_id)- returns Trend for given kpi_idprefetch_trends(kpi_ids)- loads Trends for id defined in kpi_ids sequence into cacheget_snapshot(timestamp, kpis)- returns a snapshot of kpis values at given timestampto_file(path)- saves all available Asset Data (details, trends, measurements, ...) to file defined by path
Most of the methods and properties are type-independent and are implemented in parent Asset class. However, since SmartSensor API differentiates several asset types (Motor, Generic Machine) that represents different types of monitored machines, there are child classes of MotorAsset and GenericMachineAsset, that inherit form the parent and provides a specific implementations for following methods:
find_anomalies_and_trends()- returns AnomalyDetectionResults for the Asseton_off_trend()- returns ON-OFF Trend (general information if the machine was on or off).status_trend()- returns the status Trend (general information about asset's condition).operational_stress()- computes Operational stress Trend (part of old condition indices).environmental_stress()- computes Environmental stress Trend (part of old condition indices).reliablity_index()- computes Reliability stress Trend (part of old condition indices).get_condition_indices()- returns AssetsConditionIndices (new condition indices).
In addition to above, MotorAsset provides extra methods and properties that are unique to motors:
rated_details- collection of motor rated parametersefficiency_class- estimation of motor's efficiency classpole_pairs_no- number of motor's pole pairsload_trend()- computes estimation of motor's Load Trendinput_power_trend()- computes estimation of motor's Input Power (electric) Trend
Important
Asset Reports uses Asset objects of corresponding type. That is, MotorAssetReport expects MotorAsset, and GenericMachineAssetReport - GenericMachineAsset
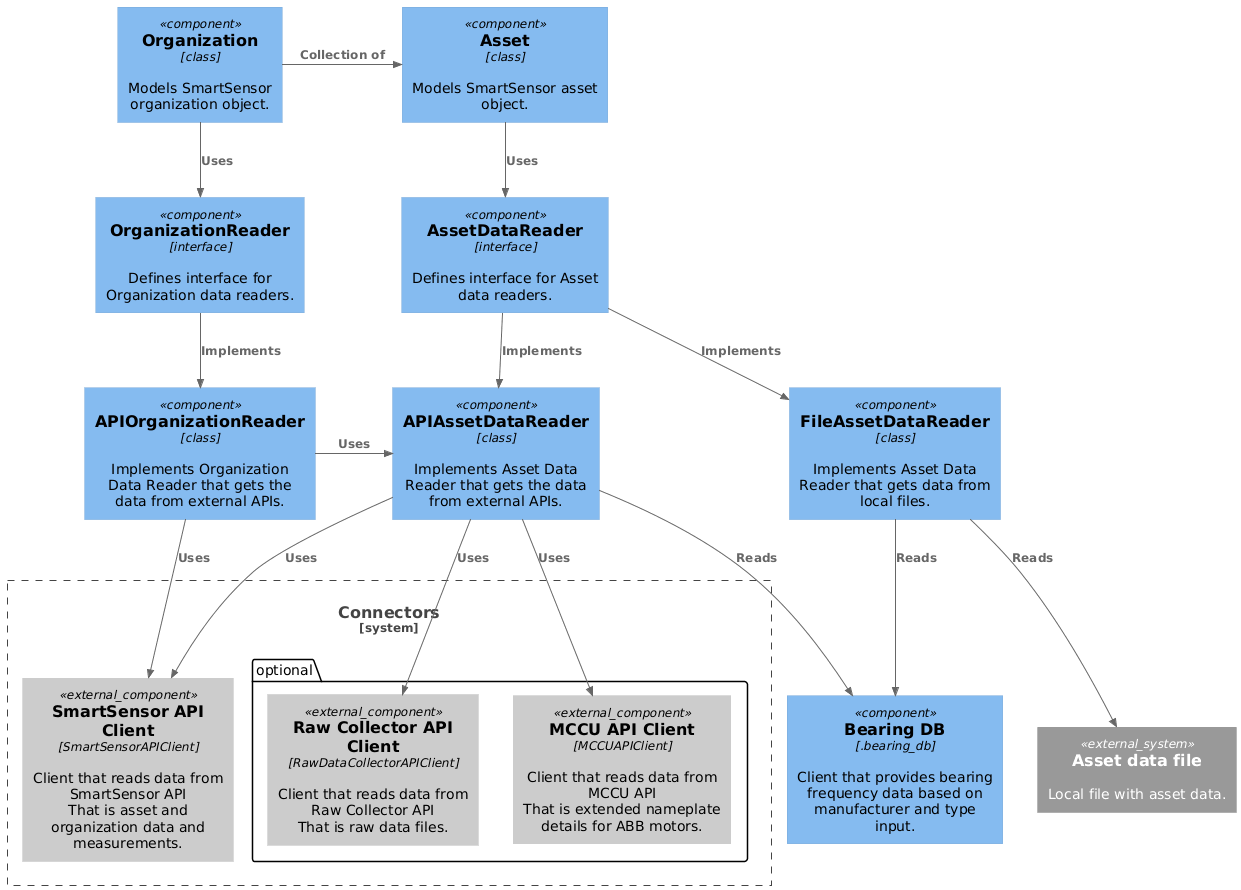
Asset data reader
AssetDataReader is an interface that declares methods for reading all the data that is important for an Asset in
the reporting context. Some of those methods are described below, for all please refer to the AssetDataReader definition
at smartreport.datatypes.reader.asset.AssetDataReader
get_measurements(asset_id, start_date, end_date)- returns a list of JobMeasurements objects that were collected between start_date and end_date for Asset with asset_id.get_trend(asset_id, kpi_id, start_date, end_date)- returns a Trend object with values for a given kpi_id from Asset with asset_id, start_date and end_date.get_threshold(asset_id, kpi_id)- returns a Threshold object for given kpi_id from Asset with asset_idget_type(asset_id)- returns asset type of Asset with asset_idget_asset_details(asset_id)- returns the full set of asset related metadata, like asset properties, sensor data, asset type and asset's organization details.get_mccu_nameplate_detail(asset_id)- returns a value from MCCU extended nameplate for given asset_idget_bearing_frequencies(manufacturer, model)- returns BearingData for a given manufacturer and modelget_condition_indices()- returns AssetConditionIndices
There are two implementations of AssetDataReader available: FileAssetReader and APIAssetReader.
FileAssetReader reads data from a custom JSON files that stores all needed information about a single Asset. This implementation is used for development purposes only.
APIAssetReader uses SmartSensorAPIClient for to get trends, measurements (located on SmartSensor backend)
and asset_details, RawDataCollectorAPIClient for measurements located in Raw Data Collector, MCCUAPIClient for MCCU data and
ConditionIndicesAPIClient for new condition indices data.
Since this data is read from external sources (which is a time-consuming process), caching is implemented.
By default, standard @lru_cache decorator is used on data fetching methods.
However, for Trend fetching that is not enough and custom LRU cache is implemented.
There is one more implementation available at smartreport.datatypes.mock.asset.ADRMock that can be used
in tests as a mocked AssetDataReader that generates random Asset data.
Organization
Organization is a data structure that holds collection of assets. It is based on Organization structure in SmartSensor, and it is identified by Organization ID
It has to be initialized organization_id, start_date, end_dateand an instance OrganizationDataReader that can provide information about organization and can create instances of Asset objects that belongs to it.
Organization provides following methods and properties:
name- Organization name.all_assets- Yields all assets objects belonging to the organizationmotor_assets- Yields all motor assets objects belonging to the organizationget_number_of_assets()- Returns a number of asset objects in the organizationprefetch_trends(kpi_ids)- loads kpi_ids Trends into cache.
Organization data reader
Similarly to Asset data reader, it is an object that know how provide data related to SmartSensor organization. Interface declares following methods and properties:
get_list_of_asset_ids(organization_id)- returns a list of asset ids that belongs to the organization with organization_idget_asset(asset_id)- returns an instance of Asset object with asset_idget_name(organization_id)- returns a name of organization with organization_id
There is one main implementation of that interface: APIOrganizationReader that uses
SmartSensorAPIClient for SmartSensor data. For testing purposes there is ODRMock implementation
that can be found at smartreport.datatypes.mock.organization.ODRMock
Drive data readers
Drive Asset
As an analogy to SmartSensor assets, Drive Asset class was defined. It follows the same principles as Asset class and defines the same methods whenever it's possible. It is initialized with serial_number (asset_id equivalent), start_data, end_date, and instance of DriveDataReader object that knows how to read drive data from external sources.
Following methods and properties are defined for it:
trend(kpi_id, table_id)- returns a Trend for kpi_id from table_idaggregate(aggregate_id)- returns a DataFrame with data from table defined by aggregate_idaggregated_trend(table_id, trend_kpi)- returns AggregatedTrends object that is a collection of aggregate trends (mean, min, max, std) of the same kpi_idget_scatter_df(table_name)- returns DataFrame with data for scatter plots.get_nameplate_detail(key)- returns a drive's nameplate detail defined by keyevents()- returns a list of events
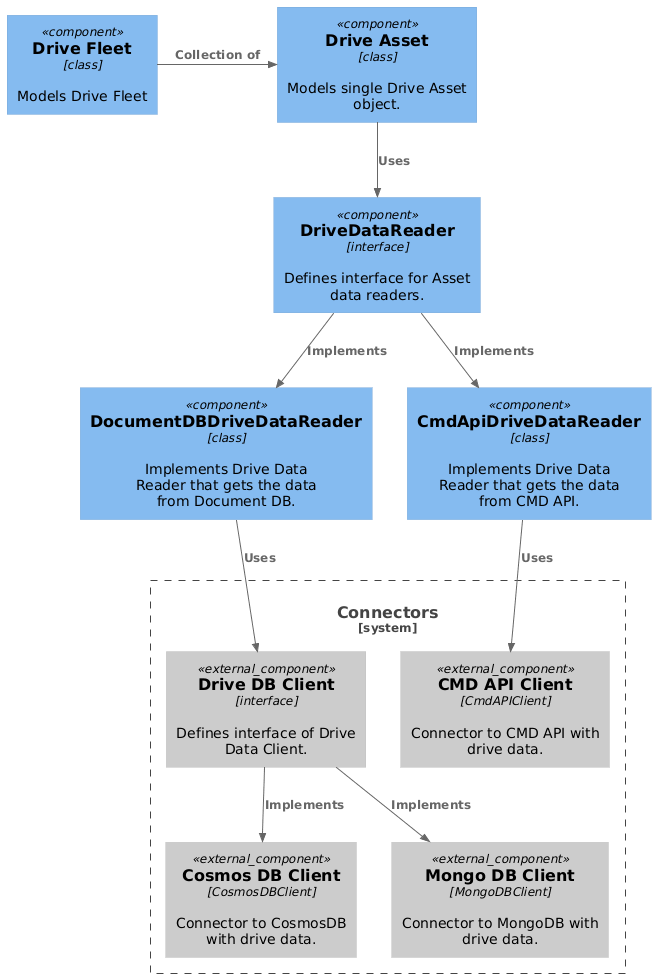
Drive Data Reader
Interface declares following methods:
get_trend(serial_number, kpi_name, table_id)- returns Trend objectget_threshold(serial_number, kpi_name)- returns Threshold for given kpi_nameget_nameplate_details(serial_number)- returns dictionary with all nameplate detailsget_events(serial_number)- returns DataFrame with all eventsget_scater_df(serial_number, table_name)- returns DataFrame with scatter data from table_nameget_data(serial_number, kpi_name)- returns DataFrame for given kpi_name
There are two implementation of Drive Data Reader.
DocumentDBDriveDataReader uses DriveDBClient clients to read data from external Document DB. There are two implementations of DriveDBClient available: CosmosDBClient that gets the data from Azure Cosmos DB used by drive data providers from Monitoring Team (global data), and MongoDBClient that gets the data from Mongo DB used by drive data providers from Chinese Team (chinese drives only).
CmdApiDriveDataReader uses CmdAPIClient client to read data from CMD API.
CMD stands for Condition Monitoring for Drives.
It's main ABB service to monitor drives. It's an equivalent of SmartSensor Portal for drives.
Drive Fleet
Since Drive Fleet reports are available, Drive Fleet structure has been developed. There is no equivalent of Organization existing at drive data providers and Drive Fleet is purely internal concept used only for the sake of reporting. This also means, that Drive Fleet can represent any arbitrary collection of Drive Assets.
It can be initialized by providing list of DriveAsset objects.
For developer's convenience there is a from_serial_numbers() staticmethod available,
that takes list of serial_numbers end an instance of DriveDataReader and creates a list of DriveAssets
automatically.
As in Drive Asset it implements:
trend(kpi_id, table_id)- returns a list Trend for kpi_id from table_idaggregate(aggregate_id)- returns a DataFrame with data from table defined by aggregate_id and extra column that identifies the drive.aggregated_trend(table_id, trend_kpi)- returns list of AggregatedTrends object that is a collection of aggregate trends (mean, min, max, std) of the same kpi_idaggregated_scatter_df(table_name)- returns DataFrame with data for scatter plots and extra column that identifies the drive.
Additionally, it provides filter(value) method that returns a DriveFleet with a subset of drives
that met the filter criteria, and group_drives(group_keys) method that returns list of dictionaries with drives
grouped according to provided group_keys.